I've been thinking about this for some time and decided that I really should write about it. Its a little big brother-ish, but potentially in a distributed way.
Here's the genesis of my idea: I live on a reasonably small road that twists and turns, but my house is on a reasonably straight portion of that road. As a result, cars often go whizzing by at speeds far in excess of the posted 35 mph limit. I'd like to dissuade people from doing so.
Proposed system: A simple box likely consisting of an off-the-shelf point and shoot camera, a low power laser, a tuned (i.e., focused on detecting the reflection of the laser) photo sensor and a raspberry pi or an arduino. The system works best if it is connected to the internet full time, perhaps through a focused wifi antenna back to the house.
The laser pulses multiple times a second and determines of there is a car in the camera field of view. If there is, the speed/direction of the car is measured from the difference in the location of the car over time. Probably just use an average of a couple of readings when the car is in the optimal location.
When the system determines that the car is in the optimal location for a license plate reading, the camera snaps a picture, focused on the license plate area. The picture and the speed/direction information along with the time-stamped photograph would be sent to the cloud for processing. The key would be to pull the state and license plate number from the picture. Better would also be to pull the make and model (more data has to be worth more money).
At first the raw pictures could be posted publicly on a website where citizens could just focus on shaming speeders or allowing parents to check in on their kids speeding habits (really anybody could check on anybody if they knew the license plate information).
My understanding is that the courts have made it clear that this is not private information - police cars routinely drive down the road with picture scanners looking for cars with outstanding parking tickets on them. The same could be accomplished by just sitting in your front yard with a camera - the device is just making it much easier to do systematically.
One Step Beyond: Charge for access to the processed data. This could serve private investigators (PIs). They could subscribe to the site for $10/month and get access to locations of a certain number of license plates. For a premium service, they'd be able to set up a geo-fence around a location and get a text on any hits in real time (location and direction). Eventually, home-owners could get a small payment for hosting the devices based on the revenues from the subscriptions. Yes, I'm guessing the NSA would harvest this information with or without permission (but I'm sure that the company would rather get paid for it).
The value of subscription clearly goes up as the number of people providing data goes up. Business owners on busy streets could post these on their signs. Homeowners everywhere that are annoyed with speedy neighbors could provide their data to the police as justification for increased speeding patrols. As a bonus add-on, you could create an iPhone app and let people take geo-coded pictures in parking lots to record the location of vehicles. I don't know if it would be worth too much (and mall / shopping center owners would like become sensitive to it), but you could pay per data point.
I have a great spot near the road that has power. If I get motivated, I may just try to hack this system together.
Tuesday, March 25, 2014
Saturday, March 15, 2014
The State of Residential Wind Turbines
So my post yesterday about solar shingles got me thinking about roof-mounted wind turbines and what it might look like for me to install one on my house. So, I decided to do a little bit of research on the topic today. If you are interested in the topic, you should probably check out Bergey's Wind School first before you read more below. If you really want to get into it, don't read anything below. Rather go to Home Power Magazine and start your research there. There is plenty of information on the internet to decide if you should learn more - which is to say you won't be able to conclude that you should or shouldn't buy a turbine without ultimately talking to the manufacturer, or better, talking to the installation company. The balance of system and electrical integration costs are likely to be non-trival and need to be considered - its not just the per kW cost of the turbine!
Horizontal Turbines
These are the ones you think of when somebody says windmill or wind turbine. The blades spin around a horizontally mounted axis, like an aircraft propeller. Standard fare that has been around for some time and is reasonably mature (I think) in its design and engineering. Typically, these guys use permanent magnet motors and have no gearing. Simple is better with respect to reliability. Some are shrouded like the TAM Energy / Honeywell turbine.Vertical Turbines
These are not really that new, but not often used in utility scale machines. However, from what I can tell, there does seem to be a fair bit of interest in using them in roof-mounted applications. Unfortunately (though unsurprisingly), these appear to suffer from the same issues as the horizontal turbines with respect to average wind speed. See below in Take-Aways.Mounting
Roof Mounted
Two different types of roofs are dealt with - flat (common for commercial buildings) and peaked (common for residential). Both mounting systems look quite reasonable and well-engineered, but what I can't find any information about acoustic coupling with the building. Bergey cautions against roof mounting for this reason, but I don't know really how good or bad it can be. TAM Energy suggests (and includes in the sale of their turbines) a "roof box" that is added on top of the original roof. Perhaps this provides some amount of decoupling between the turbine and the roof?Pole Mounted
I think that this is most typical of all wind turbine applications. There are two options here: guy-wired setup and a self-standing pole. The latter is more expensive, but doesn't require as much flexibility with your space.
Take-Aways
There is probably nothing here for me. Bergey recommends not pursuing if you have less than 1 acre and 6+ mph average wind speeds. I have neither. Just shy of 1 acre in the suburbia surrounding DC. The 30 meter (above the surface) wind speed map provided by the government suggests that I have between 4 and 4.5 mph average wind speed. Though I do pay more than 10¢ per kWh for my electricity, its not much more. My payback period is probably quite high and would be a riskier proposition than just continuing to purchase from the utility. A vertical turbine manufacturer, Urwind, suggests that at 4.5 mph average wind speed, their product would produce very little output.
Low speed performance turbine will have to improve substantially, I'm guessing, before it will make sense for me to go down this route. This is not impossible. One of the big achievements of utility-scale wind turbines over the last decade has been to raise capacity factors from the high 20% range to the low 40's. And that is after choosing the best wind sites, previously. The same could potentially change here, though the pace of change is likely to be slower given the relatively small market size for residential wind turbines.
Though the above sites suggest that measuring wind speeds at your residence for a year is likely to be overkill (expensive and can be modeled well), I think it would be interesting to measure over the course of the year. Then, I'd cross the wind-speed duration curve with the power output curve of various wind turbines to see what opportunity to offset electricity usage that I'd have.
I think that I'd be most inclined to go with the TAM Energy / Honeywell roof-mounted turbine if I was going to do anything. They start producing power at relatively low wind speeds - 2 mph. I have space on my roof, so I'd spring for 2 - which would cost me $30,000. They claim that I'd be offsetting about 2000 kWh per year for each turbine. For me that equates to roughly (10.1¢/kWh * 4,000 kWh) = $404/year savings. That means I'd need 75 years to pay off the investment. The design lifetime of the device is only 20 years. This won't really work - even if the output was double the projected output for an average site. So much for my investment in wind power, at least for now.
To make it work, I would need to see a 7 year payback. If the performance of the turbine can't be improved, there is really just one way to make this work: reduce the cost of the two turbines by ~90% to $2,828. Not likely to happen any time soon. Probably sub-scale for the balance of plant portion, too. Which means, I think that the turbines need to improve before this all goes around.
Further Research
I have by no means exhausted the research areas for this topic. If the turbine technology improves meaningfully, I think each of the following areas would require more thought and study:- What are local zoning laws (if any) that need to be complied with? Is it any different than installing an antenna on your roof?
- What is reasonable to assume the acoustic signature is for a roof-mounted turbine?
- How much should it cost to install?
- What are the additional components required to integrate into one's home electrical system?
- How would Dominion (my local utility) deal with my power costs? How much would be truly offset?
Next up: Residential solar. Like I have noted before, I'd really like to have a solar-driven stirling engine. Or rather, a solar/propane CHP system.
Friday, March 14, 2014
Shingle Me Timbers
So the future is not quite now, but I think that this is a big step. Dow Chemical is jumping into the renewable energy fray with a solar shingle, named PowerHouse. Its a great idea. Not cheap, but a great start. Their marketing wisely doesn't focus on people who would install from scratch, but on those that would be replacing their shingles anyway.
Unfortunately, I live in Virginia and would not qualify for incentives, so I chose the next best place, Washington DC. The website estimates that I could save a substantial amount of money in electricity costs (over 25 years) and raise the value of my house (presumably due to the decreased energy requirements). Though my house is not this large, here is the view that they provide:

Unfortunately, what I took for links in the paragraph are not links. Of course, I could talk to an expert, but I have the following complaints about the provided information:
Unfortunately, I live in Virginia and would not qualify for incentives, so I chose the next best place, Washington DC. The website estimates that I could save a substantial amount of money in electricity costs (over 25 years) and raise the value of my house (presumably due to the decreased energy requirements). Though my house is not this large, here is the view that they provide:
Unfortunately, what I took for links in the paragraph are not links. Of course, I could talk to an expert, but I have the following complaints about the provided information:
- How is the asphalt roof of -$20k value? Misleading comparison - costs only on the left, benefits only shown on the right.
- I'd like to dig into their assumptions and know what the pre-incentive cost is rather than just the post-incentive.
- How do they conclude my house value goes up by this amount?
- What is the $120k of energy savings based on? What is their forecast of residential power prices? Do they factor in DC RECs?
Perhaps the information is not shown because they are making some heroic assumptions that embarrass them. That said, by not putting supporting information, that is pretty much the only conclusion a skeptical guy like myself can come to.
Before you dismiss this post as just a solar hater, please factor in the following about my views:
- I'm a fan of solar and innovative ways to create electricity. If I could buy a solar stirling engine (claimed to be 1/2 the cost of PV) and put it into my front yard, I would.
- I have also investigated installing a series of nine roof-mounted wind turbines on my roof. A relatively modest investment of $15k could largely offset my grid usage. I'm very concerned about noise under high wind conditions.
- If organic flow batteries ever take off, the first two options will look much more interesting to me.
- However, I am a true believer in price. We are wasting our money on subsidies. See Marginal Revolution for a recent summary of different economists take on climate change. My views are squarely with Bjorn Lomborg. Stop the subsidies, ramp up the R&D. We will soon have products that are cheaper than fossil fuels and will adopt them without market distortions.
Thursday, March 13, 2014
Loss of Power
I am not an expert in the analysis of potential blackout conditions as discussed in this WSJ article. However, I find the conclusion that by taking out only four transformers (probably actually four substations) in the eastern interconnect one could cause an 18 month blackout to be extraordinarily unrealistic.
Yes, we have some issues. Some of them:
Yes, we have some issues. Some of them:
- It takes a long time to build high voltage transformers
- We don't have a lot of transformer building capacity in the U.S.
- We have relatively lax physical security for our substations
- We have an interdependent physical transmission network. Losing key interconnection points will cause pain.
With respect to the last point, it should be noted that this is a good thing. The interdependency exists because its more efficient to trade power across systems. This is due to non-coincident electrical loads and generation outages. This saves US electrical consumers (literally) billions of dollars a year.
What I find to be unlikely is that we can't respond to a major event like this. Our response would be a pain, but I think that we could avoid life-altering outcomes. We have several different ways in which we can respond (in order of escalating severity):
- Run more expensive, but more proximate electrical generation facilities. We already have market mechanisms to deal with this and a relatively robust reserve margin to cover unexpected system conditions.
- Ask for voluntary reduction in power usage by both residential customers as well by commercial and industrial. In the summer, this can take the form of raising the temperature in our houses another 5º. Or not turning on the big screen TV until 7 or 8pm (after the evening peak load usage).
- Pay industrial and commercial customers to reduce their load (off of historical baselines). There are structures (e.g., demand response) that have been effective at modifying behavior.
- Dramatically increase power rates above a certain monthly kWh usage. This is already done to a lesser extent in the retail rate structures in many states.
- Mandate a reduction in usage. For example, outlaw air conditioning usage, perhaps on alternate days of the week. Impose large fines on people using air conditioning when they should not be.
- Characterize critical and non-critical buildings and usage for power. Cut power to non-critical ones.
I could be wrong. It wouldn't be pretty, but this would hardly bring us to our knees.
Saturday, March 8, 2014
GPS Altitude Issues
I was planning on writing a rant about GPS and altitude problems. I still will, but it will be tempered, from the start, by some quick internet searching on how to fix the problem.
My issue is that when I wear my Garmin ForeRunner 405 running or biking on an "out and back," it will often show very different elevations on the route. Super frustrating. I understand some of the technical side of it. You can read here if you are interest as to why GPS is more accurate on the lat/long than the elevation, but its not necessarily an easy discussion. GPS is reasonably complicated mathematically, but the theory is straightforward.
It turns out that there are technical solutions to this very technical problem. Sites like Strava, for instance, do this correction in the background unless you ask them not to. There is a fantastic post in their help area describing in detail what they do. If you don't use Strava, all is not lost.
There are programs out there (such as GPS Visualizer) that will use the 2D representation and then map it to the "DEM (digital elevation model) database" to get the third dimension (or really, the elevation is what we care about). Unfortunately, as described in the Strava post, the best DEMs only have 10M accuracy (which seems mind-bogglingly bad to me).
While there are solutions, it still seems as if Strava and others are not taking advantage of all of the data that could be brought to bear on the problem of determining surface elevation and thus I still feel justified in complaining that Garmin doesn't correct altitude errors when I import my data. It would seem to me that there are portions of the surface of this earth that are well travelled by GPS-wearing folks like myself, that we ought to have accurate enough readings (from thousands of receivers) to detect a repaving of a trail or road. Think the Washington and Old Dominion trail in northern Virginia.
Less on the fitness side and more on the house side, I'd like a 3" accuracy model of my lot. I think that would be fantastic for modeling drainage and hardscaping/landscaping projects in the future. Perhaps that model doesn't need to integrate with the rest of the earth, it would be kinda cool if it did.
Friday, March 7, 2014
3D Painting (with ultrasound)
This is perhaps not what you are expecting, but I'll start with a vignette about what made me think of this to begin with:
So here is a proposal:
Ideally, I could have done this first when I was the model of good health. Then, when I'm in pain in some part of my body, scan it and compare the current results / sizing of everything and determine if everything is all right or I'm just being a wimp. While the latter is likely, I'd rather not be pushing myself when I shouldn't be. As I get older, pain seems to be a less reliable indicator of when I should stop.
Is this really that hard? Ultrasounds are used beyond the womb. See here and here and here and here, some of it getting into cool stuff like finding blockages in arteries or mapping blood flow using the Dopler shift from the moving fluid. It all seems focused on 2D mapping and snapshots. Why not go for the 3D that people can understand. Frankly, when I went to my wife's ultrasound appointments, I only saw random black and white noisiness. Nothing that looked like a baby. The technician saw much more, but still had to manually measure the femur and a few other spots to accurately determine the size of the baby. All of that seems ripe for automation and no need for a technician. Put the woman in the room with a tub of gel and a wand and tell here to move it around until the system tells her she's done.
Fun side project. Swallow a penny - and watch it go down through the system :) OK, maybe this is a little gross. But instead of a penny, use something else that isn't so gross. And let people track it through their digestive cycle. I don't know why that seems cool to me, but it does. You know you've heard that story of a kid swallowing a GI Joe hand . . .
BTW: I fully understand that we have a set of people working at the FDA that can barely put their pants on in the morning. This project would be "for entertainment only" and would be designed for pets. Or something like that. It seems like it would be the death of this idea if it had to be approved.
Am I missing something? Does this already exist? Let me know in the comments!
I routinely work out at the gym. Usually, this involves a combination of lifting weights, cardio and stretching. In my stretching, I'm usually doing some foam rolling to do that whole "myofascial release" thing. Unfortunately, my aging body doesn't always cooperate with whatever mix of activities I've recently subjected it to. I have one on-going issue and one new one.
The ongoing issue is in my shoulders. They apparently loose. Not morally, but in the sense that they are not quite firmly in the socket so there is more motion than would otherwise be ideal. I was told by a doctor that its likely genetic and the only real solution for it is surgery (with a reasonably long recovery cycle). And as a result of being loose, they hurt if I do too much chest or shoulder lifting.
The new problem is my left leg. Its not quite my knee, but behind my knee. As in, I can barely do child's pose without it hurting badly.As I laid there on the mat this morning, I thought to myself, "Why can't I just map my ligaments with a 3D probe and figure out if there is some tendonitis and then do the right therapy from there?" I can't, because as far as I know, nobody has tried to put something together to do this.
So here is a proposal:
- A USB-powered wand-like device similar to that of the BodyMetrix Personal Ultrasound Body Composition tool.
- iPad or Android tablet as key interface
- Priced at USD 200
- Provides a 2D image to the user in real time
- More importantly, builds a 3D model of the body tissue while the user moves it around slowly (auditory feedback indicating ideal speed)
- Potentially use two wands, though this does get a bit tricky for the operator
- Exportable 3D model to other programs.
- Tracking/automatic measurement on various body parts:
- Body fat (like the BodyMetrix). This is typically take based on body measurements at various points in the body (lower back, thigh)
- Muscle size
- Tendon / ligament size
- Belly
- UI will be key: this tool would need to have a fantastic approach to capturing the information and then making it meaningful to the user.
Ideally, I could have done this first when I was the model of good health. Then, when I'm in pain in some part of my body, scan it and compare the current results / sizing of everything and determine if everything is all right or I'm just being a wimp. While the latter is likely, I'd rather not be pushing myself when I shouldn't be. As I get older, pain seems to be a less reliable indicator of when I should stop.
Is this really that hard? Ultrasounds are used beyond the womb. See here and here and here and here, some of it getting into cool stuff like finding blockages in arteries or mapping blood flow using the Dopler shift from the moving fluid. It all seems focused on 2D mapping and snapshots. Why not go for the 3D that people can understand. Frankly, when I went to my wife's ultrasound appointments, I only saw random black and white noisiness. Nothing that looked like a baby. The technician saw much more, but still had to manually measure the femur and a few other spots to accurately determine the size of the baby. All of that seems ripe for automation and no need for a technician. Put the woman in the room with a tub of gel and a wand and tell here to move it around until the system tells her she's done.
Fun side project. Swallow a penny - and watch it go down through the system :) OK, maybe this is a little gross. But instead of a penny, use something else that isn't so gross. And let people track it through their digestive cycle. I don't know why that seems cool to me, but it does. You know you've heard that story of a kid swallowing a GI Joe hand . . .
BTW: I fully understand that we have a set of people working at the FDA that can barely put their pants on in the morning. This project would be "for entertainment only" and would be designed for pets. Or something like that. It seems like it would be the death of this idea if it had to be approved.
Am I missing something? Does this already exist? Let me know in the comments!
Thursday, March 6, 2014
When Will Wearables Explode?
Not thinking in the literal sense, but in something more than the industry hype sense. I hope that the hype has peaked and we are moving into the period of hard work where people make products attractive and usable for the masses, not just the early adopters.
Here are some ill-informed views on when I think that wearables will really take off:
Here are some ill-informed views on when I think that wearables will really take off:
- When "energy harvesting" is built-in from the start. While I am generally not too annoyed that I have to charge my fitbit once per week, I'd rather I didn't have to. It seems somewhat ironic, as well, that a device that is capturing my motion data, is not using that motion to its benefit. How cool would it be if I never had to charge my fitbit (as long as I used it)?
- Data transmission is standardized. Good example: I have a fitbit and a Garmin ForeRunner 450. Both require proprietary USB adapters to connect to my computer. Hopefully, devices will coalesce around using low power BlueTooth or some single suitable technology. Better than this, it'd be great if the devices didn't use near-field technology at all, but instead connected to Wifi and take the computer out of the equation.
- More complete monitoring. Steps are a good first step. But not nearly enough for a compelling fitness / wellness view.
- How about:
- 3D movement, interpreted, so that you don't have to log what activity you were doing. Premium systems could include multiple sensors for a better read (wrist, hip & ankle).
- Heart rate (and better yet actual ECG signal)
- Blood oxygen levels
- Respiratory rate
- Perspiration levels
- Blood pressure
- GPS location, even if only through your phone
- Some of this should be real-time, but where that gets hard, at least make near real time (like Azoi could be used right after getting off the treadmill).
- Some better understanding of how people want to change themselves (or remain the same).
- For instance, is it important to you to:
- Train for a particular event
- Just get "better"
- Remain at your current high fitness level
- Provide real feedback tailored to such. I'm afraid that this will remain in the "paid extra" category, but I don't think that it will take off until a subscription is not required. I'd be much more willing to buy a premium version of the product up front that has this built into the cost rather than a subscription and think that many others share my aversion. It boggles my mind that this isn't being done already with fitbit.
- Capture "uncapturable" information and integrate it into your product.
- AskMeEvery is a great example of how this could be done:
- Wearable user works out
- Wearable system asks user how fatigued they are after the workout (via email, if necessary)
- Wearable system determines that its pretty much the same workout as they had done three days ago
- Wearable system alerts user that they are making progress: their reported fatigue is only 8 out of 10 instead of the 10 out of 10 they reported three days ago
- To be fair, fitbit and others are doing this with food. But it comes in the "paid extra" category and still isn't easy enough to do reliably.
- Generally decrease the uncapturable information in the system. A few thoughts:
- Build a kitchen scale with wifi that can be used in conjunction with a phone app. Have people weigh their food. (Seems like this could already exist and I'm just unawares). It has to be much more accurate that taking a picture or just estimating. And easier. I had 18oz of lasagna. Done.
- [Other ideas to be added as they (hopefully) come to me.]
Wednesday, February 26, 2014
A Former FiOS Fan
I was pretty excited about getting FiOS. That was about a year ago, this is now. They've started throttling NetFlix. I'm done with them unless they publicly apologize and change.
Let me get this straight. They are holding out for NetFlix to pay them to pass along network traffic that their (Verizon's) customers are demanding. For which Verizon's customers already paid dearly to get access to the internet. Now these same customers are just trying to use it. Seriously. Just treat your customers like dirt. Good for you - but I'm out.
[Update 2014-03-06] I didn't expect my FCC complaint to do anything. At all. But via email, I got this letter today:
March 06, 2014
Verizon Customer Advocacy
290 West Mount Pleasant Avenue
Dispatch Floor 2, DRC
Livingston, NJ 07039
Dear Mr. Bulkeley:We'll see if anything comes of it. Presumably not.
Verizon is in receipt of the complaint filed with the FCC regarding your broadband service. Verizon is committed to providing quality customer service and appreciates the opportunity to review your concerns.
I sincerely apologize for the trouble and inconvenience you have experienced. Verizon will be in contact with you regarding this matter. I attempted to contact you on the telephone number provided on the complaint and was unable to leave a voicemail for you.
Should you have any questions prior to Verizon contacting you back , please feel free to call my office at the number listed below.
Thank you again for taking the time to express your concerns. We will address your concerns as quickly as possible.
Sincerely
Ms. Thomas
Customer Advocacy
Monday, February 17, 2014
What is the hype about sapphire lens covers?
I am a reasonably disgruntled iPhone 5 photographer. I, like many others, will use the camera often. But for me, its always with a tinge of regret that I didn't plan ahead and have one of my better cameras with me. Even a 10 MP four year old Olympus Stylus 1030SW is better than my iPhone if only because the optics are not fixed.
So with that as a background, it really bothers me when one of the supposed benefits of the iPhone 5, its Sapphire lens cover is crap. I don't care how high on the hardness scale this stuff is supposed to be, it scratches and leaves behind crappy artifacts, such as in the picture below. There are no fewer than six visible problems currently. It is particularly notable on a ski trip.
Perhaps this is a problem of not only knowing how to protect some part of your device, but being OK with the failure mode. I'd say that this is a big fail for Apple.
Saturday, January 18, 2014
Insight from Fitbit?
So, I decided that I was going to do something with my fitbit data. I had to learn something from looking at close to a year's worth of data, right? I hope. My first thought was from my scale, it seemed that my body fat routinely increased when my weight was going down. This didn't make intuitive sense, and it might not actually be true. Time to test it with data!
My first attempt to do something useful was in Excel. I quickly grew tired of the stupidity of scatter plots in Excel. It was because I generated this plot:

Given that I had some issues with my labeling, I will be clear: the x-axis is weight (in pounds) and the y-axis is body fat (in %). The black lines connect data points in time sequence. You will note that there seem to be some clusters of data where the points are just a little bit too nicely spaced from one to the next, almost forming a solid line of light blue boxes. This is due to fitbit cheating.
Biggest complaint so far is the fitbit is inconsistent about representing missing data points. For blood pressure, they show up as "0/0". For weight, they come as interpolated data points. I basically have to algorithmically filter them out or I'm not going to have a very believable relationship between weight and fat. I gave up trying after doing some conditional statements. I decided that R would be a better tool.
To be able to use R, I was going to have to export the data I wanted to a csv. I decided to find an online R platform and did find one that uses my favorite plotting package (ggplot2). I am a big fan of R-serve, which I use at work all of the time, but didn't find any servers online that let people mess around on it.
Unfortunately, it didn't like the forward slashes in the excel csv export. I foolishly decided to use TextWrangler's grep'ing capability to find and replace the dates. I say foolishly, because I thought that I remembered how to use it, but didn't really. I had to refer to some find and replace strings I had pulled together for work. Ultimately, the date find took the form of:
And . . . it wouldn't upload. So, back to the desktop version of R. So here is my best effort so far (using ggplot2):
 The plot also includes a linear regression of the data and the standard error band around the estimate. Despite my initial theory, it looks like my body fat readings are reasonably well correlated with my weight, but only reasonably well. Its a 20% adjusted R2, but the p-value for the model is 4.1e-8.
The code to generate this is right here:
codehere::codehere
It occurred to me that I should really first be interested in how my weight evolved over time. This is what fitbit.com provides:
 I think it hides too much of the variability. Here's my plot:

The code to generate this plot is simpler:
ss
Clearly, my goal weight is 160 pounds. I'm a bit closer than the last data point here, down to 163.5 pounds. But what is driving my weight gain & loss? Is it potentially related to my activity level? Let's see.
Let's at least start with what my calorie burn looks like. First, just day by day (are there any trends) and then by day of week. Here we go:
 and the daily average (violin plots with the mean represented as a green dot):
 By far, it looks like Saturday is my busiest day, in terms of activity. But the distribution of Saturday overlaps the other days of the week from lazy to super active. I guess I have my slow weekend days, as well. Another view is very derivative and slightly easier to create - that is a monthly view:
 I really don't know why January looks so high (this is only the tail end of January 2013), perhaps its just the small number of data points. It does look like after summer I slowed a bit down and picked it up a bit through November, getting lazier in December again.
And the code to generate the above:
codehere::codehere
Not surprisingly, there is a strong relationship between steps and calories burned. I think that it'd be reasonable for some dispersion due to other activities that I log (e.g., lifting, biking). It looks like the outlier day of less than 5,000 steps, was one where I rode 50 miles on my bike. So I guess it could make sense.

This simple relationship has an adjusted R2 of 49%, roughly meaning that about half of the variability in calorie burn is explained by steps. What really happens by fitbit is a bit more complicated. I believe that their calculations incorporate the amount of time that you are active - in various states. The better model would look like the following:

This model (its construction shown in the code below) has a 90% adjusted R2 with and an F-stat for the model of over 825. I think that indicates significance. Interestingly, the time sedentary is not a (very) significant variable, but the model thinks that the intercept is. Which probably makes sense, indicating that there is just a baseline number of calories that somebody of my (roughly constant) weight would burn. The true model that they use is one of both body mass and activity. They report Activity Calories burned and the above model against that has a 98% R2, so I think that indicates a match.
codehere::codehere
Now let's get to a more interesting question/hypothesis. My guess would be that the more active I am over a period of time, the more likely I am to lose weight. Seem reasonable? Let's check it out. First we need to think about the variables available to us and whether they'd reasonably be expected to show a relationship. I think that the answer is no, given that all of the observations are for an individual day (no trending). Keep in mind that the best we are going to be able to do is capture the outflow or burning of calories. I haven't tracked my food intake over any meaningful period of time. And fitbit doesn't provide that in the dataset anyway.
So, I will have to do some transformations first, but I'll save that code until after the graph. So let's look at a weekly time period (average activity calories in a week) versus the weight change over the course of that week in the form of weight(date)-weight(date, seven days later. With that defined, I can look at the visuals:

While at first glance, this doesn't seem super good. Its mostly a cloud; don't let the fit line and the standard error band trick you. If there was something there, it would be in the direction that I think that it should be. That is to say, as my activity increases, my weight decreases. The model's adjusted R2 is only 3%. This isn't to say that there couldn't be a different date range that we should be looking over, but I would be concerned that we are finding a spurious relationship. Even if we did find something, I think that it would be worth doing an in-sample/out-of-sample test for significance.
Before I forget, here is the code:
codehere::codehere
So I'm out of reasonable questions to answer with this data. How about some random questions:


My first attempt to do something useful was in Excel. I quickly grew tired of the stupidity of scatter plots in Excel. It was because I generated this plot:
Given that I had some issues with my labeling, I will be clear: the x-axis is weight (in pounds) and the y-axis is body fat (in %). The black lines connect data points in time sequence. You will note that there seem to be some clusters of data where the points are just a little bit too nicely spaced from one to the next, almost forming a solid line of light blue boxes. This is due to fitbit cheating.
Biggest complaint so far is the fitbit is inconsistent about representing missing data points. For blood pressure, they show up as "0/0". For weight, they come as interpolated data points. I basically have to algorithmically filter them out or I'm not going to have a very believable relationship between weight and fat. I gave up trying after doing some conditional statements. I decided that R would be a better tool.
To be able to use R, I was going to have to export the data I wanted to a csv. I decided to find an online R platform and did find one that uses my favorite plotting package (ggplot2). I am a big fan of R-serve, which I use at work all of the time, but didn't find any servers online that let people mess around on it.
Unfortunately, it didn't like the forward slashes in the excel csv export. I foolishly decided to use TextWrangler's grep'ing capability to find and replace the dates. I say foolishly, because I thought that I remembered how to use it, but didn't really. I had to refer to some find and replace strings I had pulled together for work. Ultimately, the date find took the form of:
(?P\<month>\d)/(?P\<day>\d)/(?P<year>\d),and the date replace looked like:
20\P<year>-0\P<month>-0\P<day>,I got there, anyways. It then did make it quick to replace the slash in the blood pressure column. I wanted to replace "0/0" with "0,0". And I replaced the "Blood Pressure" with "Systolic" and "Diastolic". This was a simpler find string, that I made too complicated, perhaps:
,(?P<systolic>\d+)/(?P<diastolic>\d+),and the replacement:
,\P<systolic>,\P<diastolic>,The only problem was that I had 352 rows of data and it made only 351 replacements. I hate searching out the one problem child. One trick is to throw the csv into excel and look for column shifting (I've created a new column with this replacement). It should be pretty quick given that excel will generally automatically recognize the comma as the column separator. And if it doesn't - "Text to Columns . . ." works in a jiffy. It turns out that one row has a non-interger reading for the diastolic, so it didn't match my grep. Rather than fix the pattern, I made an ad hoc change to the csv.
And . . . it wouldn't upload. So, back to the desktop version of R. So here is my best effort so far (using ggplot2):
The code to generate this is right here:
codehere::codehere
It occurred to me that I should really first be interested in how my weight evolved over time. This is what fitbit.com provides:
ss
Clearly, my goal weight is 160 pounds. I'm a bit closer than the last data point here, down to 163.5 pounds. But what is driving my weight gain & loss? Is it potentially related to my activity level? Let's see.
Let's at least start with what my calorie burn looks like. First, just day by day (are there any trends) and then by day of week. Here we go:
And the code to generate the above:
codehere::codehere
Not surprisingly, there is a strong relationship between steps and calories burned. I think that it'd be reasonable for some dispersion due to other activities that I log (e.g., lifting, biking). It looks like the outlier day of less than 5,000 steps, was one where I rode 50 miles on my bike. So I guess it could make sense.
This simple relationship has an adjusted R2 of 49%, roughly meaning that about half of the variability in calorie burn is explained by steps. What really happens by fitbit is a bit more complicated. I believe that their calculations incorporate the amount of time that you are active - in various states. The better model would look like the following:
This model (its construction shown in the code below) has a 90% adjusted R2 with and an F-stat for the model of over 825. I think that indicates significance. Interestingly, the time sedentary is not a (very) significant variable, but the model thinks that the intercept is. Which probably makes sense, indicating that there is just a baseline number of calories that somebody of my (roughly constant) weight would burn. The true model that they use is one of both body mass and activity. They report Activity Calories burned and the above model against that has a 98% R2, so I think that indicates a match.
codehere::codehere
Now let's get to a more interesting question/hypothesis. My guess would be that the more active I am over a period of time, the more likely I am to lose weight. Seem reasonable? Let's check it out. First we need to think about the variables available to us and whether they'd reasonably be expected to show a relationship. I think that the answer is no, given that all of the observations are for an individual day (no trending). Keep in mind that the best we are going to be able to do is capture the outflow or burning of calories. I haven't tracked my food intake over any meaningful period of time. And fitbit doesn't provide that in the dataset anyway.
So, I will have to do some transformations first, but I'll save that code until after the graph. So let's look at a weekly time period (average activity calories in a week) versus the weight change over the course of that week in the form of weight(date)-weight(date, seven days later. With that defined, I can look at the visuals:
While at first glance, this doesn't seem super good. Its mostly a cloud; don't let the fit line and the standard error band trick you. If there was something there, it would be in the direction that I think that it should be. That is to say, as my activity increases, my weight decreases. The model's adjusted R2 is only 3%. This isn't to say that there couldn't be a different date range that we should be looking over, but I would be concerned that we are finding a spurious relationship. Even if we did find something, I think that it would be worth doing an in-sample/out-of-sample test for significance.
Before I forget, here is the code:
codehere::codehere
So I'm out of reasonable questions to answer with this data. How about some random questions:
- Do steps correlate with Floors climbed? (i.e., when I'm active, am I active in both ways)
- How long do I sleep when I track my sleep? I have been super inconsistent in tracking it, even though I use my fitbit as an alarm clock on weekday mornings. How does the fitbit data compare to the AskMeEvery data that I've been collecting for the last two weeks?
Let's tackle these. For the first, here is the graphic:
With a 35% R2, I think its safe to say that there is some correlation, but its really not definitive. See the data point at about 17,000 steps - that would be one floor climbed that day. It can happen. I guess. 150 floors seems like a lot. but I also took ~17,000 steps that day. So there is something there.
And now for sleep. Here's what I've gotten from AskMeEvery:
So I sleep a lot on weekends. I try to get 7.5 during the week, it happens, though 7 is much more likely. How did the fitbit data compare?

Given the limited data from AskMeEvery, I think these are essentially equivalent. What it does indicate, I think, is that on a night that I think that I get 7.5 hours, I'm really getting ~6. The rest of the time is getting to sleep and restlessness during the day.
Finally, the code for the last two fitbit graphs:
codehere::codehere
Reflection on the data and FitBit
I have looked around on the web about what people think or have learned by using their FitBit. It can be summed up as:

- I didn't realize how sedentary I am/was
- I walk more because I'm wearing a FitBit
- I like getting badges
Aside from general behavior changing on the margin, I'm unimpressed with what I see out there. I think my original review holds up fairly well. I think the following two changes should be made (at a minimum):
- Add the alarm alerting you that you've been sedentary too long. Let the user choose this, but provide links or other guidance on the website about what might be a useful interval. I addressed this in more detail in my initial review.
- Add the option that goes beyond their "Step Goal Milestones" that alert you when you've hit "75%, 100% or 125% of your daily goal." These are fine notifications, but what if you just get to 70% of your goal. You never really know that. I'd prefer time-based notifications that put your day into perspective, allowing the user the time(s) of the day that they'd like to receive them (for me, 8am and noon would be most useful). I want to be motivated beyond just a fixed goal, which I'm sure most users have never changed from the day they set up their FitBit. The message I want is like the following:
- You've taken X steps so far today. This is at the Yth percentile of the last week and Zth percentile of the last month. Only A steps until your goal!
To keep its users engaged, I think FitBit really needs to do more. I'm not super convinced the solution is my first anniversary email:
Maybe it'd be more interesting to tell me where I fit in the distribution of all FitBit wearers. Answer questions like the following:
- I've worn my consistently over the last year. Have I worn it more than 90% of their customer group? Shouldn't that make me feel good?
- For people my age (weight/sex/zip code), where am I in terms activity over the last 12 months? Weight gain / loss? Body fat gain / loss?
- Talk some about the FitBit community - in aggregate, how many pounds lost, miles travelled, steps taken?
- [I will add more as I think of them]
Other thoughts out there?
Wednesday, January 8, 2014
Protection!
I am renting out a room in my house and went downstairs to check on the smoke detector. When I did, I found that there was no smoke detector. I did some quick research on Amazon and found that I would probably spend about $40 for a combination carbon monoxide detector. I thought for a bit and broke down and bought a nest Protect. It came today.

While it was more complicated to install than your average everyday smoke detector / carbon monoxide detector, it wasn't very hard. It does, however, require a mobile device to which you can connect to it via wifi. Given that I already had a nest Thermostat (and a nest account), there was little to do during the setup process except for name the device (choose the room) and enter my Wifi network's password. The folks at nest thoughtfully included the first batch of six AAA batteries; I'm hopeful that they last for some meaningful amount of time. If things go well with this one, I will consider adding more to other levels of the house. Or, it might be better to wait until they add thermometers to communicate with my nests.
Four screws (provided) later and I was good to go. Now, my phone will get an alert when the house is on fire!
Tuesday, January 7, 2014
Frozen Nest
I've just had a reasonably bad experience with my nest. I guess I had recently agreed for the nest to manage our heat based on the auto-away setting. When I got home last night from work, the house was crazy cold (60º upstairs), despite the fact that the boys were home all day. They were home, but by and large just sitting in front of their computers, not doing much of anything involving motion, which the nest would have picked up on indicating that they were home.
The reason that I'm unhappy with this nest experience is two-fold:
The reason that I'm unhappy with this nest experience is two-fold:
- The low temperature tonight is forecasted to be in the single digits and I'm concerned about pipes freezing. I wanted to keep my house reasonably toasty to minimize the potential for burst pipes and expensive clean-up.
- The nest was never able to bring the house up to temperature. When I went to bed, the nest was up to 65º - not comfortable - and the furnace has been running non-stop.
What this points to is the following:
- The auto-away feature should have an additional limit: this should be the amount of time that you are willing to wait for the house to get back up to the target temperature. This should take into account your house's modeled behavior and the current and forecasted temperatures. I should be able to say that I never want it to take more than 1 hour to get to temperature. The nest would then ensure that it could get the house up to that temperature (and if somewhat extreme temperatures were forecasted, it would take that into account, dynamically setting the low temperature mark).
Let's get on it nest! Or other software providers, now that the API is supposedly available.
Saturday, January 4, 2014
Nest - Data-free Badness
I have two Nests installed in my house for my upstairs and downstairs HVAC systems for some time now (since 2012-02-26), but I haven't written about it since I made my first post with my initial thoughts after installation. I thought I'd share my current thoughts on the product.

What's Awesome (in no particular order):
- Super easy installation. Best in class instructions. Covered more in my original post.
- Ability to control my thermostat remotely via an iPhone app. Cool stuff. My kids (who live on the upper level) and I have a bit of a war with setting the temperature during the summer, but I always win.
- Auto-Away: it learns when you are not around and automatically cuts back on your energy usage.
- Monthly reports: Nest will email you a short summary of your energy usage and
- Beautiful design: it looks good and its easy to use.
What's (still) Not Awesome
- I still can't get my data. It turns out that I could have if I was willing to go through some gymnastics (see Gregory Booma's blog post - he provides a script to import the data into R, one of my favorite tools). Unfortunately, Gregory has updated this as of 2013-12-03 saying that due to Nest introducing their API, the functionality described in his post is not available any longer. I'm inclined to sign up as a developer, but would rather have intermittent access to all of my historical data, I don't want to have to set up a server to capture my data. This was a $250 thermostat. I think that they could give me the ability to download a CSV every so often.
- Given that I can't look at my data myself, the app and website still seem very underdeveloped. You just can't look at much. 10 days of history is it. That is pitiful. See the graphic below. Its crazy how much more my system ran last night (almost non-stop) when the temperature fell to 10ºF. Sadly, that's a lot of propane.
- But what was running? Was it just the fan running (I have the fan on the 15 minutes an hour schedule for greater comfort), or was the furnace chugging away burning propane? Really guys, you couldn't figure out a way to represent this on the same graph?
- Why are graphics covered up to the point I have no idea what they are?
- Why can't I see a sparkline of the temperature in the house? The humidity? This seems stupidly obvious that I'd want to be able to see the history here.
- I can't connect the Nest to supplemental temperature sensors. I'd love to have between six and 12 wifi (or Z-wave) sensors reporting to the Nest and be able to set up rules such as:
- Run heating (cooling) if any of the sensors gets below (above) a defined set point.
- Warning if the temperature gradient is higher than a defined level (e.g., 10ºF). Help me trouble shooting by showing me the variation of all of the sensor over time. I'd love to be able to tweak my registers in a way that limits variation and increases comfort.
- Allow me to activate register boosters (my term): basically, registers with supplemental fans to increase airflow to particular rooms or sections of the house.

Friday, January 3, 2014
A Failure to Broadcast
I blogged before about doing some outdoor wifi so that I could use my outdoor stereo system. While this setup worked in the testing phase, it turned out not to work after everything was installed. It also had the disadvantage that I could no longer use my Aria wifi scale - setting up the Amped Wireless SR10000 required me to turn off the wifi band that the scale depended on. After I had figured out the system wasn't working, I switch my Apple network back to including the missing band (I think it was g). I've been bouncing around in my head how to solve this problem and just recently concluded that I should just use another Apple product.
To be clear, what I mean to set up is another AirPort Extreme (APE) extending my Apple-based wireless network to the outside. The key, though is the ability to get the external antenna hooked up to my APE. This is where the research came into play. And I will admit, it was slow going on my end.
I did find a website that sells modified APEs, but they were substantially marked up (to roughly $135). [I can't find the link at the moment, but when I do, I will link it]. This was way more than I wanted to spend, so I kept looking. Eventually, I found this installation guide on MacWireless.com. While the site also sells the connectors, I decided to hunt around for them elsewhere; I am much more interested in buying on a trusted site. Amazon didn't let me down - I found just what I needed. Free shipping, too. That said the shipping time is between 17 and 28 days. No worries, though, I need this for summer not for the present.
Right now, here is a view of my network configuration (with a big thank you to Gliffy - of which I'm a big fan), click through to get the full-sized version:

I'm thinking that I'll I will need to do is find a 10/100 Mbps repeater and replace the APE with that and then move my APE into the box hanging off of my eve. The APE then would be directly connected to the large, externally mounted antenna. From there, I'd up the power level to the max and see how my wifi coverage looks throughout the house and outside. If I need the additional interior coverage, I will purchase another APE and place where my existing one is. I'm debating whether or not I really need a Gigabit switch, or if 10/100 Mbps will be sufficient (and I think I have one lying around). I think that will be the first attempt and then if it doesn't work, I'll look at purchasing a $40 5 Port Gigabit switch.
A minor change to the configuration represented below (and a more complete representation of the network, including wireless devices and labeled cable runs):

I think that's a pretty full network - 50 devices directly connected. And I'm guessing that I don't have the most of folks out there.
Wednesday, January 1, 2014
Tracking Your Critters
It has been said that over half of the genetic material in or on our bodies is not human in origin. One area where there has been a lot of study in the last five years has been on the flora in our guts. The bacteria in our guts has been linked to various problems - ulcers, obesity, stupidity (ok, maybe not the last one). There is now a start-up out there looking to help you understand your very own flora. They call themselves uBiome. I think that they should be call uPoop and then you can have an iPhone app called (obviously) iPoop where they deliver the results of your most recent stool sample.
Joking aside, this looks super interesting to me and when the prices drop to something less than $89 per sample, I might dive in (so to speak). I do have some concern that the FDA will shut them down in a way similar to 23andMe, so I'll wait until that gets sorted out, too.
Joking aside, this looks super interesting to me and when the prices drop to something less than $89 per sample, I might dive in (so to speak). I do have some concern that the FDA will shut them down in a way similar to 23andMe, so I'll wait until that gets sorted out, too.
Your Data is Yours for a Price
I've recently blogged about how I think personal data should be owned by those generating it. Related, I was just thinking about how long I've owned my fitbit - almost a year - and that I was going to have to write a post summarizing my thoughts on living with a fitbit for a year. As part of that, I was ready to bitch and moan that they do not provide their users with access to their own underlying information. To make sure this was a true statement, I did some quick Googling.
What I found was not very satisfying on a few different levels:
What I found was not very satisfying on a few different levels:
- Access to your own data is only available if you a premium subscriber - that is, you pay an additional $49.99/year (after you've already bought the device).
- Even when starting a seven day free trial period to download the data, it is only available with nothing greater than daily granularity. A bit of poking around on the Google Group for fitbit developers indicates that only a "select few" developers will have access to sub-daily data.
- The data is presented poorly - there are three separate sections in the CSV: body, activities, sleep. All are keyed on date. Why not one section with more columns?
- The data has odd inconsistencies:
- If you request dates for which you hadn't used your fitbit, you will get information that isn't real - i.e., no minutes of activity rather than null values
- For data where you have limited entries - weight, blood pressure, resting heart rate, etc., fitbit does different things: weight is repeated, blood pressure is 0/0 instead of NA, resting heart rate is 0 instead of NA.
I'm still down on the whole environment that is out there now. That said, I signed up for a MeetUp group (for DC) that is associated with the Quantified Self.
After I've had a chance to go through the data, I will share my insights (if any).
After I've had a chance to go through the data, I will share my insights (if any).
Tuesday, December 31, 2013
Magical Fastener Technology
I recently installed a bike lift in my garage and had some thoughts on fasteners. The core product is great (a few pulleys, bike grabber hooks and some rope) and works well. I installed one over a year ago and bought a second because I found the first one useful and I have more than one bike. When I installed the first one, I used my own screws, leaving the ones provided just to screw the cleat into the wall. This time, I used the fasteners provided to install the metal brackets to a 2 x 4. This post is largely born out of frustration with the cheap, crappy fasteners that came with the device.
Here are my complaints:

Here are my complaints:
- The fasteners do not say what exact Phillips head form they have. This results in the installed guessing and not likely finding a perfect match. A couple of potential solutions here:
- Put in your instructions exactly what form it is. This is the lowest cost and easiest approach. I find it inexcusable that it was not done.
- Include in your installation kit the perfect driver for your included fastener. This is the most hassle-free approach for the customer and preferred by me.
- The fasteners provided are not hardened, such that if you catch the screw a little bit off, you will end up shearing off the material and render the screw head useless for further driving.
- The fasteners are intended to be driven into wood. Perhaps you don't need to pre-drill a hole, but some folks my want to do this. The instructions should provide guidance as to the diameter of a pre-drilled hole (i.e., "use no larger than a 3/32" hole if you decide to pre-drill screw holes"). Without pre-drilling, these screws were really, really tough to get into a pine 2 x 4. This isn't exactly hardwood.
Given that installation of a product is so close to its purchase (and the likely time that a customer will provide feedback in the form of a product review), I find it incomprehensible that product manufacturers don't do a better job at this. Its not rocket science - in fact, it is in most ways not even a technology issue. Perhaps it could be universally solved with better technology, but I don't think that we need to go there (nor may the costs be worth it).

Ruined screw head . . . not likely to get fixed any time soon
Monday, December 30, 2013
When Does a Product Stop Being Useful?
Introduction
As my recent post indicates, I just finished installing the last bit of surround sound in my house. Its pretty cool when everything is working correctly. When its not, I can be no fun. Here are some of the problems I have had with my Sharp Aquos TV / Pioneer VSX-1122K / Roku 2 XS / Verizon FIOS Router (core components for this discussion) setup. You will note that the Roku, VSX and router are all connected via ethernet cable (i.e., wireless connectivity hasn't been one of my problems).Problem Discussion
- Easiest one of the bunch: sometimes the picture from the Roku turns purple. Basically, everything has a purple hue to it. This is not solved by pulling out the HDMI cable and resetting the HDMI connection. Solution: unplug the Roku, wait 30 seconds, plug it back in. Unfortunately, you have to wait for the Roku to boot up, which takes a surprisingly long time. It is a good thing that Netflix and Amazon save your spot when you are streaming a movie or show.
- VSX stops responding to commands sent to it via the iPad app. Whenever this happens, it will also be unavailable for AirPlay. Sometimes, we'll live with this problem for a while before its fixed. If you want to change your input source or volume level, it requires walking over to the island (not in the viewing room) and making the change. Somewhat of a pain, but can be a useful short-term fix if you want to watch something right away. There are two potential solutions:
- Most of the time, unplug VSX for 30 seconds and then plug back in. Give it a few minutes to find itself on the network.
- Rarely, doing the above doesn't work. Then I will unplug the VSX, unplug the FIOS router. Then plug back in the FIOS router, wait for about 5 to 10 minutes and then plug back in the VSX. There is probably an easier way to do this (force a DHCP reset for the VSX's MAC address - but whenever I've looked, I haven't been able to figure out which device was the VSX).
- VSX stops sending video whatsoever. This was the most troubling problem I've had. I was quickly able to troubleshoot by switching out the cable from the TV to the VSX and putting it directly into the Roku. So the TV and Roku and HDMI cable were all good. Then using the remote on the VSX and getting no video sealed the deal. The source of the problem was the VSX. Not good. Solution: power the VSX down for 30 seconds, then plug it back in.
- While watching the TV, there will be a quick green flicker across the screen. I think that this is some sort of HDMI handshaking issue. Sadly, I have found no solution to this. It appears to be the fault of the VSX - it does not occur when the TV and the Roku are directly connected. It has been mitigated with the Roku by setting the Roku to display in 1080p, but it hasn't gone away. It is tolerable, but still an annoyance. There is a firmware update that is supposed to improve HDMI stability, but after trying 4 different USB drives (and reading a bunch of forum posts about formatting, etc.), I have been unable to make the VSX recognize the thumb drive.
- Why is it that cycling the power fixes 90% of problems? Shouldn't there be an easier way?
- Why don't manufacturers build in error checking routines into their equipment that recognize the problem and allow for a more elegant fix to the problem?
- Finally, why are user manuals so lame? This isn't a terribly serious question - I have no hope that they get better. That said, I think that its ridiculous that the best place to find answers is not the Pioneer website.
So back to our key question for this post. When is your average consumer done with a product or system (i.e., it has lost its usefulness)? How much pain can they tolerate in the form of the device or system not working? What are the key drivers for consumer behavior that distinguishes one set of people from another? Are there variations in people's expectations for one class of good versus another?
Perfect Product
Perhaps one place we could start it by defining the perfect product. My definition will start out as follows:
The perfect product is one that always performs the function it was designed to performThis immediately causes some problems for consumers. Many don't know how to use a product and will blame the product instead of their own ignorance in how to use it. While I'm pretty sure that my problems as laid out above are not due to my ignorance, they could be. But maybe, the perfect product definition should be amended to:
The perfect product is one that always performs the function it was designed to perform in a way that a user will always correctly use it.User interface matters. We all know this. Apps will make it much easier for electronics manufacturers to get this right. The ones that don't, will disappear. Is that enough? Probably, if we were living in a perfect world. Perhaps we add the following:
The perfect product is one that always performs the function it was designed to perform in a way that a user will always correctly use it. The product is aware of what its output should be and alerts the user to problems when they occur.Purple screen - Roku, you should know better. You should be looking. Let's go a couple of steps further:
The perfect product is one that always performs the function it was designed to perform in a way that a user will always correctly use it. The product is aware of what its output should be and alerts the user to problems when they occur, automatically correcting the problem, or as a last resort, telling the user how to correct the problem.
Even so . . .
Even if we are able to make a perfect product, it will likely only be able to evaluate its performance and potentially the performance of its input. In no event is it reasonable for the device to evaluate the performance of downstream devices. So, if our purple Roku problem was actually caused by the TV, it'd be unreasonable to blame the Roku for the error. Nonetheless, devices that are intended to work with others, or in a system, should be as aware as possible of their surroundings. They should be able to evaluate the quality of their inputs and their outputs. Perhaps I am intending to watch as show consisting of life on a purple world, but probably not. I don't think that this too much to ask for. The VSX should be providing a warning on its LED face saying that the video output has failed, cycle the device.Enough is Enough
I don't have a good answer to the question posed at the beginning of the post. I think that most folks will stick with a product if it performs the way its intended 90% of the time or greater for tech-savvy people and 98% for non-tech-savvy people.. At least this is my guess for home electronics. After that, it just gets to be too much of a hassle. I think most of the change in behavior comes from "abandoning in place" unless the device is critical to your viewing experience - or is the fault of somebody else - like your cable box.My system is not currently performing at the 98% level. I'm living with it, but hoping for more. Its still useful and sounds great, but I'm hopeful. That said, I have only one real basis for hope. Pioneer has released an update to the firmware. I'm terrified to run it, but one of the stated improvements is "stability of the HDMI connection". The other is "Improve the stability of the NETWORK features". Both need improving.
Sunday, December 29, 2013
Odd Expectations
I recently finished up a long-term project of installing surround sound into my TV room. My son and I enjoyed the fruits of my labor this evening by watching After Earth and Stardust. Though I had seen Stardust before, I both enjoyed it more and felt that it offered more epic sound than did After Earth. The surround sound-iness was pretty sweet.
It was a pretty big hassle fishing wires through the walls (see a couple of pictures below) and my son asked two questions:
I'm sure that I'm missing some of the reasons for this analog world still existing, but on the otherhand, perhaps this is a crazy big market opportunity for somebody.
Here are a few pictures of my pain:

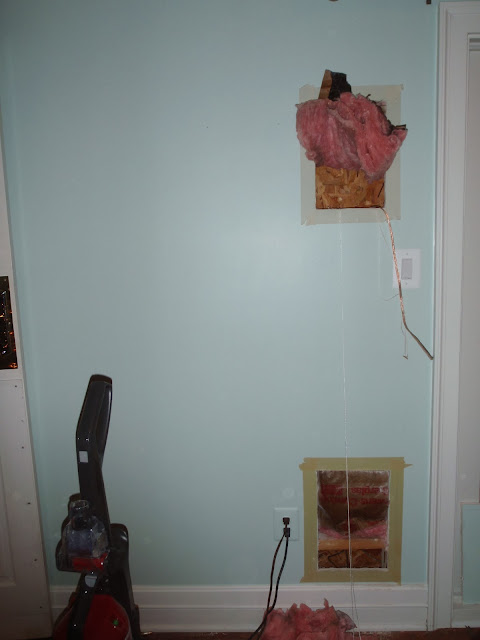

It was a pretty big hassle fishing wires through the walls (see a couple of pictures below) and my son asked two questions:
- Why aren't all speakers wireless yet?
- Why aren't all speakers digital yet?
He was quite flabbergasted that there was an analog/powered signal traveling from the amplifier to the speakers in our setup (with the exception of the sub-woofer -- but that was still a line level analog signal).
Here are my thoughts as to why this is the state of affairs:
- There has to be significant advantages for making the change.
- For wireless: While there would be a huge advantage in terms of not having to fish the speaker wire through the wall, any advantage there is likely undone by the fact that you have to get 120 V (i.e., licensed electrician) power to the location.
- For digital: There would have to be a noticeable improvement in the sound to add the complexity of the D/A conversion to each speaker. I haven't read about this at all and don't know what sort of improvement is possible, but I'm guessing that its not substantial. I'd be willing to be challenged on this.
- The new technology would have to work as good as the wires its replacing. Remember when bluetooth audio first came out? The headphones were buggy and pretty much ruined the listening experience. It took years for the kinks to be fully worked out.
- A bit of an aside, but I will note that the subwoofer that I bought has the option to attach a wireless module to it (900 MHz, I think). After reading the reviews online, I was convinced that it was unlikely to work very well - and if it did, something could come along and mess with it in the future.
- There has to be standards for equipment makers - otherwise its just a mess for consumers. Perhaps somebody can be first and succeed with no standards (Sonos?) but I think it unlikely for the rest of the stereo/speaker industrial complex to latch on to standards for which they'll have to pay high (potentially very high) licensing fees for in the future.
- It can't cost substantially more than the equipment its replacing. There will certainly be a trade-off between installation labor costs and equipment costs, but it strikes me that the speakers and system can't cost way more than the existing options. Putting a high-quality D/A converter on each speaker would have to raise the cost.
I'm sure that I'm missing some of the reasons for this analog world still existing, but on the otherhand, perhaps this is a crazy big market opportunity for somebody.
Here are a few pictures of my pain:

Trying to drill on an outside wall is very much complicated by the presence of insulation!

To make this work, I had to cut a second hold to facilitate getting through the insulation. And I wouldn't have been able to do it (I don't think) unless I was willing to sacrifice some home security wires (for a system that I'm not using).

Done! (except for the lower drywall repair and some fresh paint - ok, fine, mostly done!)
Sunday, December 15, 2013
Its My Data: A Call to a New Data Framework
The more that I see good examples of how we are starting to convert information around us to semi-permanent digital information. Here are all of the pieces of information around my house:
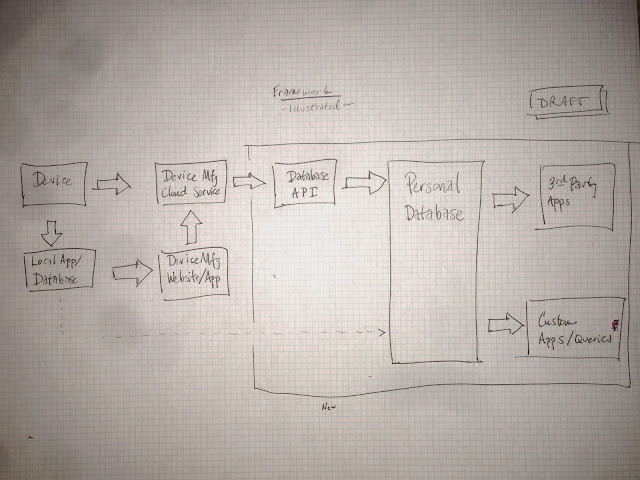

- Nest: temperature and thermostat settings
- MiCasaVerde: lighting and other scene settings; garage door opening/closing
- Roku: NetFlix (other sources, too) viewing history
- Fios DVR: TV recording/watching history
- Phillips Hue: lighting/hue
- TED: electricity usage
- Automatic: Automobile efficiency / usage
- Fitbit: personal activity monitor, weight and body fat
- Computers: computer activity monitor
And one future tool(s) that I anticipate using:
- Parrot Flower Power
All of this is great except for one thing: we (as the end customer) don't have control of the data. Our information is spread out among a bunch of different websites being of value only to that particular environment in a way that only they (those running that website) allow. That is not good enough - it has to get better for us.
Here are the issues:
Here are the issues:
- What happens to my data when the manufacturer shuts down or loses interest?
- How can I integrate all of this data into a story or picture of my life?
- How would this control of data to be achieved?
- What should the framework look like?
- Will IFTT ever get off the ground?
Ideal Framework
For the individual to keep control of their data, we have to totally change the paradigm in which we operate. We will need the following frameworks to be in place:
Remote SQL
This should be a protocol that allows external sources of information to post the information to our personal SQL database. This would include not just datum, but the ability to create the tables in which the data was kept. The external entity would never have the right to delete data from these tables, only to change the active or current status of the data (the user would be allowed to change it back if s/he wanted to).
Strong Security
The user would have to be able to manage keys as a routine matter. Therefore, their personal data hosting option would have to be able to create and manage keys.
Infinite Flexibility
There should be no real limitations on what the device databases do, as long as the user has provided the access to the application to do so. Ideally, there would be six to ten simple questions or check boxes for people to click when setting up an app. Each would be labeled as essential (if the app can't function without), or nice to have.Framework Schematics
Here is my initial cut:

Right now, the only boxes that exist are on the left-hand side (and not in all instances)

[Note that Mfg refers to the device manufacturer]
Problems with this Approach
I can imagine that there would be a number of problems with my approach and substantial hurdles to get over.
Speed and Flexibility
The device manufacturers will not likely want to have problems with their app or customer-perceived delays as a result of relying on the information residing in the personal database. As a result, they will likely want to keep the original data on their servers; unfortunately, this would subvert the whole point of giving the customer control of their data.
Who Pays for It
This is always a problem. Who wants to end up having to pay $50/year for data hosting? I would - if it meant that I had control over it. That said, I realize that I'm not a normal user of technology.
Added Complexity
This adds something else to the mix to go wrong - which the manufacturer will likely feel like they will be blamed for even if it is a data hosting problem.
Benefits with this Approach
Lower Startup Costs
There should be fewer things to do / to setup for the manufacturers. Maybe this means its simpler?
Ecosystem Integration
If a device manufacturer has a great, but simple product, they should be able to fit into a bigger world of data with some suggested power means of making somebody's life better.
A Way In
I think that the earliest place where this approach can be taken would be with GPS information. Due to the evolution of the products and the local control of the data, there are several third party applications and strong customer control of their data. I have a Garmin 405 watch that captures both my tracks as well as my heart rate profile. I can take that datafile, upload it to Strava and do what I want with it.
Generally, I don't think that this is going to happen unless customers are effective at forcing it to happen. This will likely only occur when people have woken up to the internet of things. Think IFTT catches fire and the world is clamoring for more control of their digital and real-world lives.
What's Available Already
While the applications may not be tied together in the way that I would like, there do seem to be cloud-based database services moving forward. This article has a pretty good top-line review of what is there. I'll need to spend some time checking them out to see how useful they are, but even if they are, we then need to get them integrated into an environment.
Subscribe to:
Posts (Atom)